


How MCP Works for AI Network Monitoring and Troubleshooting
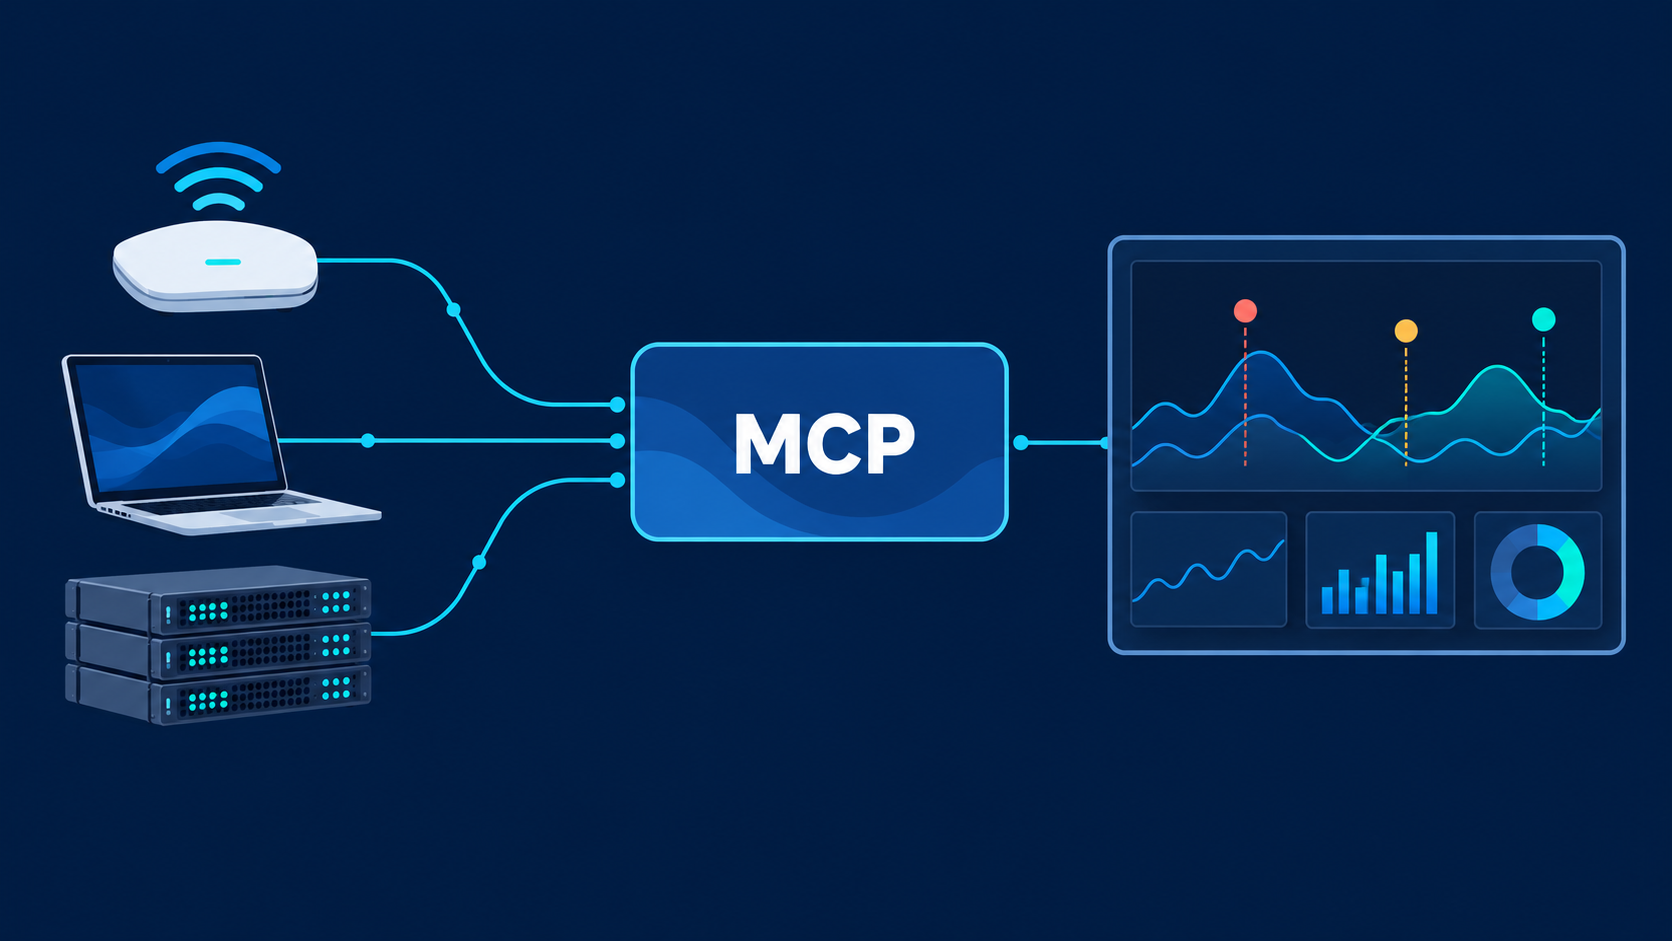
Model Context Protocol, or MCP, allows AI applications to retrieve data and use tools exposed by external systems. For network teams, an MCP integration can provide access to client telemetry, network test results, infrastructure status, and alerts. A large language model can use that information to investigate a reported problem and produce an evidence-based troubleshooting summary.
The result depends on the available measurements, the scope of the request, and the workflow used to evaluate the data. A useful investigation identifies affected devices, establishes when the problem occurred, and distinguishes observed failures from possible causes.
How MCP Connects AI to Network Data
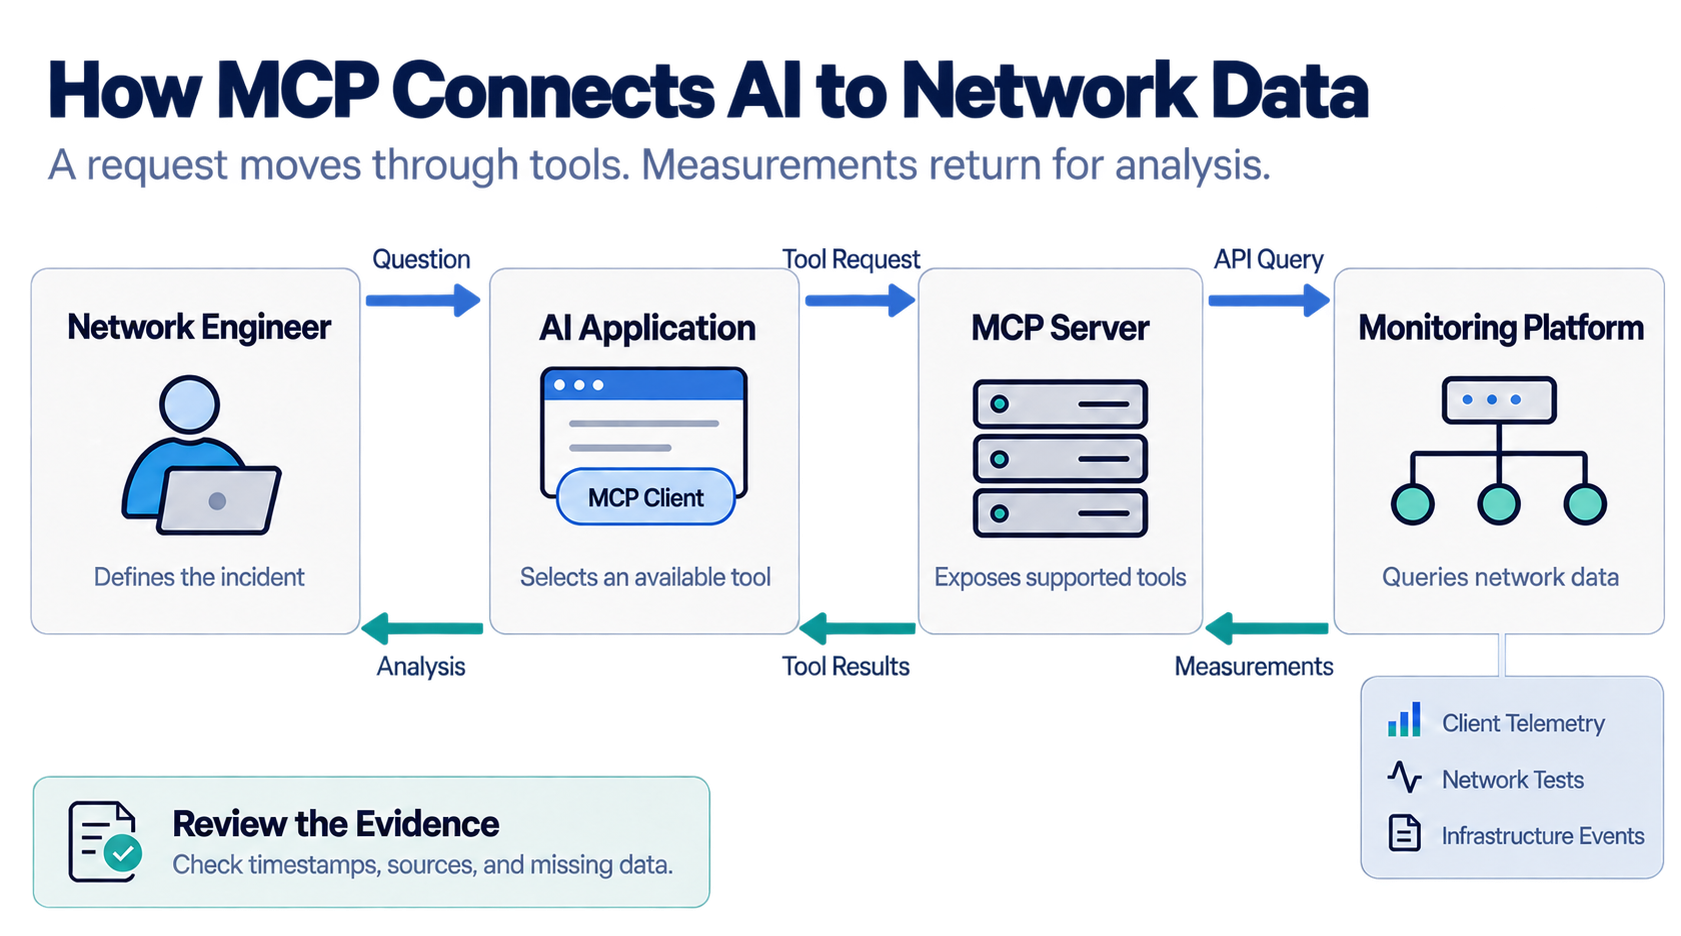
An AI application acts as an MCP host. A client component within that application communicates with an MCP server, which exposes supported capabilities. With a network monitoring integration, those capabilities might include retrieving device details, querying alerts, or collecting historical test results.
The application discovers the available tools and their required inputs. When an engineer asks about a connectivity problem, the model can request a relevant tool call. The application executes the request through the integration and returns the result to the model for analysis. The MCP architecture documentation describes this relationship.
An MCP server may retrieve information through an existing vendor API. Its usefulness depends on what that API exposes and how clearly the server describes its tools. Connecting a monitoring platform does not automatically provide access to every measurement in its dashboard.
Why AI Network Troubleshooting Needs Current Data
A model’s training does not contain the current state of your WLAN, DHCP service, or WAN circuit. Troubleshooting requires data from the incident window, including the affected location, devices, and services.
Uploaded logs and CSV exports can provide that context. MCP supports retrieving it through tools, reducing the manual work of collecting information from separate systems. Historical queries also matter because a healthy network at investigation time may have failed when the user reported the issue.
Current data still requires interpretation. A low RSSI reading can support an RF hypothesis, but it cannot independently explain an application timeout. DNS failures, authentication delays, packet loss, and upstream service problems may produce similar user complaints.
Each conclusion should identify its supporting measurement, timestamp, and source. Missing data should remain visible in the result.
Using MCP for Network Ticket Triage
Ticket triage is a practical starting point because the task can be bounded by a device, location, and time range. A report that “Wi-Fi was slow this morning” needs those details before an automated investigation can produce useful findings.
A triage workflow can retrieve the affected client’s connection history and compare it with nearby clients and sensors. It can then examine relevant service tests, such as DHCP, DNS, and application reachability, alongside infrastructure events.
For example, simultaneous application failures across wired and wireless measurements would justify checking shared dependencies. Failures limited to one wireless client would justify examining that client’s connection, driver behavior, and local conditions. Neither pattern proves a root cause by itself.
The resulting ticket should contain the observed symptoms, affected scope, incident timeline, supporting evidence, and next diagnostic step. This gives the responding engineer a defined starting point and makes the analysis reviewable.
Correlating Client and Infrastructure Events
Combining data sources helps engineers determine whether separate symptoms belong to the same incident. Client telemetry describes what a device experienced. Infrastructure records describe conditions reported by APs, switches, gateways, and other systems.
An investigation may show WAN connectivity loss and wireless client disassociations occurring during the same incident. That combination justifies further investigation of the event sequence. The timing alone does not establish why the clients disconnected.
Normalize timestamps before comparing sources. UTC and local timestamps, daylight saving changes, clock drift, and different sampling intervals can make unrelated events appear connected. Preserve the original timestamps and document any conversions.
For mobility complaints, include the serving BSSID, transition events, authentication results, and available client measurements. Wyebot’s How Wi-Fi Roaming Works and How to Improve It explains the client decisions and WLAN conditions that shape those events. An AI-generated explanation should be checked against that behavior and the captured evidence.
Comparing Events Across Data Sources
Illustrative example. Times are relative to the first recorded event and do not represent a measured incident.
| Data Source | T+0 s | T+5 s | T+10 s |
|---|---|---|---|
| Gateway | WAN connectivity lost | — | — |
| Sensor | — | Reachability test fails | — |
| Client | — | — | Disassociation recorded |
Compare timestamps and collection intervals before interpreting the sequence. Events occurring close together warrant investigation but do not establish causation. A dash means no event is shown in this example.
Creating Reports From Network Measurements
MCP can support reports that answer a specific operational question. An engineer might request a comparison of client RSSI and packet loss during a reported outage, or identify devices with repeated network test failures over the previous week.
Reports and graphs can use Wyebot DEX Agent data. A sensor MCP integration can support similar workflows using sensor measurements. Available tools and deployment status should be verified for the environment being connected.
Useful reports preserve measurement units, timestamps, sampling intervals, and missing values. Vendor health scores need a definition because they may combine several measurements and may not be comparable across products.
For calculations and charts, use retrieved numerical data with a calculation or plotting tool. Check that displayed values match the source results. A chart showing low RSSI alongside poor application performance supports further investigation, but additional measurements are needed to establish causation.
Enriching Alerts With Network Context
An alert workflow can collect related evidence before notifying an engineer. For example, a failed connectivity test might trigger checks for repeated failures, affected SSIDs, nearby client impact, and recent infrastructure events.
A Grafana alert can initiate an AI-assisted review, followed by a formatted notification. Implementing that workflow requires a trigger and an execution environment, such as a webhook handler or automation service. MCP supplies access to tools and data within that workflow.
Define escalation rules outside the model where predictable behavior matters. Critical alerts need a delivery path that remains available if the model times out, a connector fails, or the analysis is incomplete.
During evaluation, compare enriched alerts with the original monitoring stream. Track missed incidents, unnecessary escalations, processing delays, and whether the supporting evidence helps engineers act.
Making MCP Workflows More Consistent
A reusable skill or runbook can define the investigation procedure. It should specify the intended data source, required inputs, checks to perform, and report format. Loading and applying these instructions depends on the AI application.
A request about “clients” can lead an assistant toward CRM records instead of endpoint telemetry when both data sources are available. Naming the monitoring platform and device population reduces that ambiguity.
A network investigation runbook might include the following items, depending on the workflow.
- Required site, device identifier, time range, and time zone
- Approved data sources and permitted tools
- Checks for missing, stale, or incomplete results
- Evidence required before proposing a cause
- Output fields for findings, uncertainty, and next steps
- Escalation behavior when the investigation cannot finish
These instructions improve repeatability, but execution can still vary. Test the workflow against known incidents, healthy periods, and incomplete datasets before using it for routine operations.
Starting With a Controlled Workflow
Begin with a read-only investigation that has a clear result, such as producing a client connectivity summary for a specific incident window. Limit access to the required systems and data. Keep configuration changes behind the organization’s existing review process.
Restrict queries by time range, site, and device to control processing cost and avoid unnecessary data collection. Confirm how the selected services handle network identifiers, user information, credentials, and retained conversation data.
Evaluate the workflow against practical measures, including investigation time, factual errors, missing evidence, and usefulness to the responding engineer. Expand its scope when those results demonstrate that the workflow is reliable enough for the intended task.
For a demonstration of these workflows, watch the related MCP webinar with Adam Wilson, covering network troubleshooting, reporting, and alert analysis.
Frequently Asked Questions About MCP for Network Monitoring
What is MCP in network monitoring?
Model Context Protocol, or MCP, is a standard that lets AI applications access tools and data from external systems. A network monitoring MCP server can expose capabilities such as retrieving alerts, querying client telemetry, or collecting test results. Available measurements depend on the integration and its permissions.
How does MCP help with Wi-Fi troubleshooting?
MCP can give an AI application access to client connection history, signal measurements, network tests, and infrastructure events. The application can use those results to summarize symptoms and propose diagnostic steps. Engineers should validate conclusions against the source data, particularly when several failures occur together.
Can MCP automatically fix network problems?
MCP can expose tools that perform changes if an integration supports them and grants permission. Automatic remediation also requires an execution workflow and defined controls. A practical starting point is read-only analysis, with configuration changes handled through an approved change process.
What is the difference between MCP and an API?
An API defines how software interacts with a service. MCP standardizes how AI applications discover and use exposed capabilities. An MCP server can call an existing network management API and return the results to the AI application.
Does MCP provide continuous network monitoring?
Continuous monitoring requires collectors, tests, or event sources that observe the network. MCP provides an interface through which an AI application can access supported data and tools. Scheduled investigations and alert-driven reviews require an execution environment that initiates the work.
See Wyebot’s Network Data in Practice
Request a demo to explore the client telemetry and network test results available through Wyebot and discuss MCP integration options for your environment.