
Blogs
Problem of the Week: How Responsive is Your Network Infrastructure?
July 15, 2019
How important is the response time of network infrastructure? For anyone looking for a high-performing wireless network, the answer is very important. Network response time, or network latency, is a measurement of the amount of time it takes a packet to travel from sender to receiver. Response times vary based on the number of users, different networks, and other factors, and should be kept low. A sudden spike in response time indicates a performance problem, and negative user experience. This makes it important to continuously monitor critical pieces of infrastructure – including DHCP, DNS, and RADIUS servers – for the analysis and identification of performance problems. Continuous monitoring helps to proactively identify and troubleshoot any issues, enabling IT to take action before an issue impacts users, and to achieve network optimization.
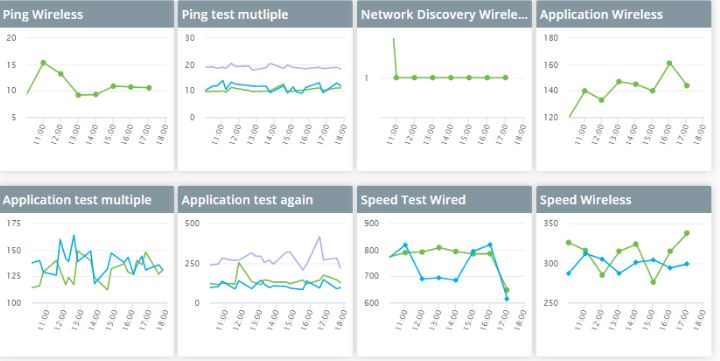
Wyebot’s Wireless Intelligence Platform™ (WIP) automatically creates and displays graphs with results from network testing, including details on the DHCP and DNS server response times. Each graph can be expanded to view historical data for the past day, week, or month, allowing server performance to be viewed over time. Details include: RADIUS response time, DHCP response time, per-host DNS resolution times, and DHCP lease information. Take a look at three ways these graphs help eliminate finger-pointing and optimize performance with 100% network visibility.
DHCP Response Times
- An optimally-functioning DHCP server is critical for efficient client connectivity. Every client device must connect to the server in order to be assigned an IP address to properly communicate on the network. If there’s something wrong with the server – if it assigns duplicate IP addresses, or if it becomes oversubscribed and can no longer hand out IP addresses, or experiences other intermittent issues – devices experience poor performance or may be completely unable to connect. WIP’s graphs reveal the health of the server over time, and enable IT to quickly see any sign of degradation for proactive problem resolution.
Business Critical Applications
- These applications could include G Suite, Office 365, or even applications necessary for statewide testing in schools. With continuous network testing, WIP captures every data point related to the health of the application; there is no missing information and no long hours trying to manually capture packets. Information is gathered from the client perspective, and graphs reveal any changes in performance over time. IT receives details on exactly what component is experiencing degradation.
Internet Connectivity/Internet Performance
- Frequently, connectivity issues are intermittent, making them incredibly difficult to capture manually. Schools and businesses need to consistently see the expected performance outlined in a SLA from their internet service provider.but with intermittent issues, how do they know if performance is degrading slowly over time? WIP’s tests proactively monitor Internet health, and graphs make it immediately obvious what performance looked like over the last day, week, or month. With graphs, there is no time spent looking through logs for data; information is automatically there for IT whenever it is needed.